


The Five Game Win Streak Is the Highlight: A First Sixth Report

Luis Garcia was excellent last night, as he and the bullpen held the Tigers to two runs. Which was a lot like Thursday’s game, when the Jose Urquidy and three bullpen arms limited the Tigers to two runs. Which was a lot like Wednesday, when the Astros, led by ace Justin Verlander, limited the Mariners to two runs. And then Monday and Tuesday were even better—Astro hurlers shut out the Mariners in both ballgame led by quality starts from Jake Odorizzi and Cristian Javier.
The Astros are on a five game win streak, and in that win streak, they have limited their opponents to six runs scored. The offense has been middling during this streak, scoring 4 runs per game, but the pitching has made that stand up.
The five game win streak puts an exclamation point on the first 27 games of the Astros season, an important marker or this blog. Why does the 27th game matter? Because it is exactly one-sixth of a major league baseball season. Many prefer to use the end of the month to designate the markers of a baseball season. I prefer 27 game increments because it makes the math easier.
After 27 games, you just take a stat--say the fact that the Astros have won 16 games--multiply it by 6, and you get the pace for the season. So 16 wins times 6 is 96 wins. The Astros are on a 96 win pace so far. Good, but not great. You can also take Yordan Alvarez’s performance so far—15 RBI and 15 runs scores—multiple that by 6, and see that Alvarez is on a pace for 90 ribbies and 90 runs scored this year.
After the second 27 game increment, we'll be at 1/3 of the season, and you can multiply by 3. After the third 27 game increment, we'll be halfway through the season--multiply by 2.
So just as how a business will talk about how they are doing each quarter (i.e. each quarter of the year), here at Breathing Orange Fire, we'll talk about how the Astros are doing each sixth.
The Record
Overall Record: 16-11 (.592)
Record This Sixth: 16-11 (.592)
On Pace for a Record of: 96-66
What was the Astros record last season after 27 games when they won the AL West and the AL Pennant? It was 15-12. They are ahead of their pace from last year.
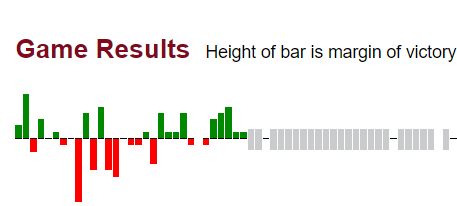
Yet, Astros fans often acted like the sky was falling during the first month of the season. And the team was at or around .500 until the recent 4/5 game win streak against the Mariners & Tigers moved their record well into the good side of .500
The team won 4 of the season’s first 5 games, taking 3 of 4 from the Angels and winning their series opener in Arizona. They then slumped, losing 8 of their next 11, including a 4 game losing streak to the Angels and Blue Jays. Since losing the series opener in Arlington, the Astros have won 8 (9) or 11.
The sparklines graph below shows this story. Strong at the start. Slumping in the middle, and then strong at the end.
The Offense
Team Offense & MLB Rank.
R/G: 3.8 (20th). OBP: .296 (22nd). SLG: .384 (14th). OPS: .680 (17th). OPS+: 101 (16th).
In 2021, the Astros led the American League in runs scored, batting average, and on base percentage, and finished 2nd in OPS and OPS+. The numbers above show that the team has—to date—declined offensively so far this season. They are averaging less than 4 runs a game after scoring 5.3 runs per game in 2021. It’s a big decline.
Of course, some of that is caused by the ball. The ball being used in MLB this season has greater “drag” on it, which is reducing how far it carries. There is much less offense in baseball this season—the average team scored 4.53 runs per game in 2021, but only 4.09 runs this season; league batting average has declined from .244 in 2021 to .233 this season.
The overall league decline explains some of the Astros offensive decline, but only a small part of it. They are hitting worse than “expected” by Statcast batted ball data. The team’s batting average is 41 points below what is expected and its slugging percentage is 86 points below expected. That’s the first and fifth biggest different respectively of any team in the majors.1 These numbers indicate that there will be some regression coming for the Astros offense, and that regression will be in a positive regression. It can’t get here soon enough.
The Pitching
Team Pitching and MLB Rank
RA/G: 3.41 (6th). FIP: 3.73 (14th). WHIP: 1.11 (5th). K/9: 7.9 (24th). BB/9: 2.8 (7th)
For as frustrating as the hitters have been for Astro fans, the pitching staff has taken up the slack. The team is 6th best in baseball at preventing runs and has a positive run differential.
In 2021, the pitching staff was middle of the pack in both strikeouts and walks. This season, they are in the bottom third of the league when it comes to striking out batters, but are walking relatively few batters. Between the lower walk rate and their ability to avoid giving up hits, Astro pitchers are top 5 in the league in WHIP—walks & hits per inning pitched. They are facing fewer baserunners than most teams, and that helps them keep runs off the board.
The Fielding
Team Fielding and MLB Rank
Fielding Runs Above Average: 15 (1st). Defensive Runs Saved: 21 (1st). Ultimate Zone Rating: 3.9 (7th). Outs Above Average: 14 (2nd). Errors: 10 (4th-T).
A huge piece of the success of the Astros in the 2021 season came from their defense. They ranked top 5 in the majors in the all of the statistics listed above and the defensive advantage was a key to their victories over the White Sox and Red Sox in the American League playoffs.
Over the off-season, they lost a Gold Glove shortstop and their team got older.
And yet, the defense may be better in 2022 than it was in 2021. The early data support that idea. And a big reason why the defense has remained at the top of the league is that they do not seem to have declined at shortstop. Jeremy Pena has 4 Fielding Runs Above Average, which is 11th best in the majors. And that’s one of his worst defensive ranks. He’s credited with 5 Defensive Runs Saved, which is 5th best in baseball, and 4 Outs Above Average (the Statcast metric), which is 4th in baseball. One defensive metric (Ultimate Zone Rating) lists Pena as a defensive liability (he’s -1.1 in that rating), but the majority show him to be one of the best defenders in baseball. It’s a welcome asset on a team that relies on its defense so much.
Notable Player Performances
Jeremy Pena .233/.302/.500 138 wRC+ 6 HR. 15 RBI, 15 R. 1.3 fWAR
Oh, and he can hit too. Pena would be providing value to the Astros if he was a poor hitter thanks to his glove. But he’s been mashing the ball—he’s second on the team in homers with 6—and leads the team in run scored. Pena was projected for between 1.5 and 2.0 fWAR in various projection systems this off season. He’s extremely likely to exceed that.
Martin Maldonado. .088/.209/.211 26 OPS+ Jason Castro. .077/.226/.077 -5 OPS+
Martin Maldonado’s home run last night was the winning margin. But outside of that, the Astros two catchers have been dreadful offensively. Maldonado, in particular, is on the roster for his defense and handling of the pitching staff, but an offensive start this bad makes it hard to make up for those strengths. If you take the 95 combined plate appearances of the Astro catchers away, the team’s slash line jumps to .235/.304/.408 for a .712 OPS. That would be 8th best in baseball.
Justin Verlander 32.2 IP. 1.93 ERA. 0.70 WHIP. 8.5 K/9. 7.75 K/BB
In both of his full seasons with the Astros, Justin Verlander led the American League in WHIP. So far in 2022, he leads the American League in WHIP. Verlander is pitching like he always has for the Astros. Even though he missed the last two seasons due to Tommy John surgery and the fact that he’s 39 years old. Incredible.
Rafael Montero. 12.1 IP. 1 ER. 8 Hits allowed. 17 Ks. 3 BB.
The Astros acquired Montero as part of the Kendall Graveman-Abraham Toro swap, and it seemed at the time that he was acquired to make the finances of the deal work. But Montero, throwing more 4-seam fastballs than he ever has in his career, has been a revelation in the Astros bullpen, quickly working his way into high leverage situations. A big surprise this year.

It’s worth noting that because of depressed offensive environment created by the ball, these numbers are down across baseball. The actual MLB batting average is 19 points below Statcast “expectations,” and MLB-wide slugging percentage is down 62 points. But the Astros numbers are well above both of these marks.