


A Winning Record Despite A Frustrating Start: The First Sixth Report
The Astros won 7 of 9 from three playoff teams and have pitched very well. They've only won 7 of their other 18 games thanks in large part to a sputtering offense.

I had a social event yesterday that started right around first pitch of the Astros-Phillies game, so I ended up missing the game.

But when I got back to my phone after the game to check the score I found out I didn’t need to. I had an long set of angry text messages from my friends who had gotten to watch the game.
So I responded “Despite the loss, the Astros have completed the first sixth of the season with a winning record. It’s their 13th consecutive winning sixth.”
My reaction is technically accurate. But my friends’ anger and frustration expressed after the offense once again could not solve the top of the Phillies rotation expresses more of the sentiment of Astros fans throughout the first sixth of the season.
The team should be better than this.
And of course, for the 9 game stretch against the Blue Jays, Braves, and Rays, they were. They won 7 of these 9 games. That was the team that we think they should be. And frankly, the team we saw in last year’s playoffs that won 11 of 13 games to take home the title.
But outside of those 9 games, the team is 7-11. They lost series to the Tigers and Rangers and split a four game tilt with the White Sox.
And you look at that and think “Yes, they should be better than that.”
Here at the Breathin’ Orange Fire substack, I divide up the season into 6 27 game sections for analysis, and produce a report after each sixth on how the team is doing.
Why 27 game segments. Each is exactly one-sixth of a major league baseball season. Many prefer to use the end of the month to designate the markers of a baseball season. I prefer 27 game increments because it makes the math easier.
After 27 games, you just take a stat—say the fact that Yordan Alvarez has 27 RBI—and multiply it by 6 and you get their season projection. In this case, it is that Yordan will have 162 RBIs on the season. Yes, that is good.
After the second 27 game increment, we'll be at 1/3 of the season, and you can multiply by 3. After the third 27 game increment, we'll be halfway through the season--multiply by 2.
So just as how a business will talk about their revenues and expenditures in a quarterly report (i.e. each quarter of the year), here at Breathing Orange Fire, we'll talk about how the Astros are doing each sixth.
The advantage of a sixth is that has enough length to it to be useful to talk about. It’s still a small sample, but large enough to find something useful in the data. And the consistency of always using a 27 game sample allows for comparisons of equal units across time.
The Record
Overall Record: 14-13 (.518)
Record This Sixth: 4-13 (.518)
On Pace for a Record of: 84-76
In 2021, the Astros went 15-12 in their first sixth of the season. Last season, they went 16-11. They are behind the pace of both of those teams despite being over .500.
In my first sixth report in 2022, I wrote that “Astros fans often acted like the sky was falling during the first month of the season” and that has held up this season. See the introduction for an example.
In my first sixth report in 2021, I wrote about the team’s “streakiness” in that season’s early going, and that has also held up this season.
A loss in the final game of the opening series against the White Sox began a stretch where the Astros lost 5 of 6 games. After breaking that streak against Minnesota, they went on a different kind of streak—winning a game and then losing a game across 8 games. They then broke through winning 6 of 7, with the final 6 of those games coming on the road in Atlanta and Tampa Bay.
“They’re back!” everyone thought. And Astros fans on social media reacted with the restraint everyone associates with social media.
The Astros then dropped the final two of the sixth to the Phillies at home. They have now won only one of their last three against the Phillies at Minute Maid Park. But in good news, they sequenced the win at the right point.
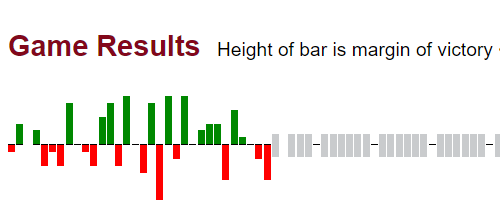
Baseball References provides these Sparklines graphs for each team and the Astros is below. The bars are green for a win and red for a loss. But what most stands out for me looking at this chart is the size of each bar. The Astros have won very few close games, and most of their wins are by a large margin.
The Offense
Team Offense & MLB Rank.
R/G: 4.6 (13th). OBP: .318 (16th). SLG: .375 (21st). OPS: .694 (20th). OPS+: 94 (20th).
Here’s the good news about the offense. After 27 games in 2022, the Astros averaged 3.8 runs per game. So by that measure, this isn’t so bad.
But on the other hand, it is bad.
The Astros are in the top half of the league in runs per game at 13th, just above league average. But in the other categories I list at the top of this section, the Astros are below league average. The team is scoring more runs than it “should.”
This is different from the early parts of 2022 when the team was scoring fewer runs per game than its other batting measures suggested that it “should.”
It is likely that the offense will improve—there are after all five sixths of the season still to come. Michael Brantley is on a rehab assignment and will likely be activated sometime in the next week or two. And Jose Altuve is recovering from his broken thumb and is likely to play the final two-thirds of the season. And we will likely see regression to the mean in positive ways from players like Jose Abreu and Alex Bregman.
But the slow start is primarily driven by the offense and the fact that they are outscoring their on base and slugging numbers is a worrisome sign for the long haul.
The Pitching
Team Pitching and MLB Rank
RA/G: 3.81 (7th). FIP: 3.68 (6th). WHIP: 1.20 (7th). K/9: 9.7 (6th). BB/9: 2.8 (6th)
After the Astros clinched the AL West last season, I wrote that they had won it thanks for their pitching and defense.
The offense may be down from expectations for 2022 but the pitching has been very good so far this season. The numbers show that Astros hurlers are consistently in the top third of the league in various pitching categories.
Notably, the team is the sixth best team in baseball in strikeouts per nine innings and walks per nine innings. Put those together, and they are second in strikeout to walk ratio at 3.45, behind only the surprising Twins pitching staff.
From 2017 through 2021, the Astros won primarily because of their hitting. That changed in 2022 and the team won primarily because of its pitching. I had thought that with the departure of Justin Verlander and the addition of Jose Abreu, the 2023 would be more balanced.
But to this point, it is a team that has relied on its pitching to carry it to a winning record.
The Fielding
Team Fielding and MLB Rank
Fielding Runs Above Average: 3 (14th). Defensive Runs Saved: 4 (11th). Ultimate Zone Rating: 4.8 (4th). Outs Above Average: 3 (9th). Errors: 9 (4th).
To me, one of the most valuable elements of the Sixths Reports is that it allows me to pay attention to the team’s defensive metrics. In both 2021 and 2022, these numbers were outstanding. For example, the Astros finished third in the majors in Outs Above Average (the defensive metric that uses Statcast data) in both seasons.
This season, they have posted worse team defensive numbers in the early going. They are behind the top tier defensive teams in every fielding metric, except for Ultimate Zone Rating (UZR).
What is odd about this is that the Astros have fared worse under the UZR metric in recent years. They were the fifth best team under this metric in 2021 and seventh best last season, their lowest rank among the four advanced defensive metrics.
And the shift in UZR rankings speaks to one potential reason that the Astros have declined defensively—they can no longer use aggressive shifts. As Bryan Cranston keeps reminding us, Major League Baseball decided that teams can no longer put their fielders in the optimal places and, as a result, the number of ground ball singles we have seen this season has increased.
The Astros were one of the most aggressive teams at using the shift in recent seasons and to great effect. The Fielding Bible credits the Astros with saving 35 runs in 2022 due to their use of the shift; they saved 13 runs in 2021, 19 in 2019, 10 in 2018 and 14 in 2017. This season, that same metric says the Astros have saved 1 run from shifting their infielders.
UZR does the least of the defensive metrics to account for the shift and paints the most optimistic picture of the Astros defense. They can get to balls once they are hit from where they are standing. But the other metrics show that one advantage the Astros had over other teams—where they position their players before a ball is hit—has been neutered by the shift ban.
Notable Player Performances
Yordan Alvarez. .269/.383/.551. 6 HR. 27 RBI. 94 PAs
I don’t know if you know this, but Yordan Alvarez is really good at hitting a baseball. He leads the team in slugging, home runs, and RBIs. The good news is that he was back in the lineup last night after 4 games off due to a neck issue.
Mauricio Dubon .302/.327/.385 .712 OPS 99 OPS+. 4 Fielding Runs Above Average
Dubon had the big 20 game hit streak, but there is a good argument that he has produced more value with his glove than with his bat. Part of that argument is that he is an outstanding defender. And part of that argument is that he is not taking walks (3 walks) or hitting with much power—only 7 extra base hits, none are homers. But regardless, this is much better production than we expected at second base with Altuve out.

Hunter Brown 30.1 IP. 2.37 ERA. 1.06 WHIP. 9.5 K/9. 3.0 BB/9. 0.8 bWAR
According to the bWAR metric, Brown has been the team’s most valuable pitcher over the first sixth, edging out Framber Valdez and Bryan Abreu by decimal points. He leads the starters in ERA and has proven a worthy addition to the team’s top flight rotation.
Alex Bregman. .214/.341/.340. 92 OPS+. 4 2B. 3 HR. 19 BB. 15 SO. 15.4 BB%.
Bregman notoriously starts slowly in April, and well, he is doing it again in 2023. With that being said, Bregman is maintaining his excellent plate discipline. His walk rate is 15th best among qualified major league hitters.
Jose Abreu. .243/.276/.279. 57 OPS+. 4 BB. 27 SO. 4 2B. 0 HR. -0.5 bWAR
Yep, it has been as bad a start with the Astros for Abreu as you imagined. The good news is that April is Abreu’s worse month over his career. The bad news is, well, you can see the stat line.
Great work, love the breakdown by 6ths concept! I wish other teams had someone using this format when analyzing their production. Thanks for your contributions🙂❤️⚾️