


Can the Astros Outslug the M's? Can the M's Walk Their Way to a Series Win? An ALDS Preview
The Ms draw a lot of walks, and Astro pitchers allow too much. The Astros keep opponents from hitting home runs and the Mariners do not. Watch these two stats in the ALDS.

Behind an excellent pitching performance by Luis Castillo in Game 1 and an improbable comeback in Game 2, the Seattle Mariners won their Wild Cart round series over the Toronto Blue Jays. Their reward? A matchup in the ALCS with the best team in the American League.
As an American League West team, the Mariners are a very familiar foe for the Astro fans. They play them 18 or 19 times every season, and are big stars of #AstrosAfterDark.1 The Astros had little drama this season in winning the AL West by 16 games, but the closest the season got to high drama was when the Astros ended the Mariners 14 game winning streak with a sweep in Seattle right after the All-Star break.
As such, this is a familiar opponent. Yet one that is not as good as the Astros. The Mariners scored 690 runs and allowed 623. The Astros did better in both categories—scoring 737 runs and allowing only 518. The Astros won the AL West by 16 games over the Mariners and it was not a fluke.
Yet, playoff series are not always won by the better team (if you see a Mets fans today, give them a hug; they need it). The better team often wins, but not always.
In this preview, I will look at the pitching staffs of both teams, the fielding and the then the hitting. As you can see from the run scoring numbers above, the Astros have their biggest advantage in run prevention, despite the fact that the Mariners are an above average team in keeping their opponents off of the scoreboard. So I focus their first.

Then I turn to the offensive numbers, where the Astros have an advantage, mostly driven by having better star level players than the Mariners. The Mariners have an offense that has strengths, but is not as strong at the top as the trio of Yordan Alvarez, Jose Altuve, and Alex Bregman. The Mariners were close to league average in scoring and the Astros can keep their bats from getting hot this series.
How can the Mariners overcome their run scoring deficit? By drawing walks. The Mariners are excellent at drawing walks while Astro pitchers are middling in walk rate. The first key to this series for the Astros is reducing the Mariners one true advantage and keeping the walk rate down.
The second key involves hitting—and more importantly preventing—home runs. The Astros have a modest advantage in hitting home runs over the Mariners, and a big advantage in preventing homers. Joe Sheehan has coined the term “ball go far, team go far” to explain success in the playoffs. Astros pitchers need the opposite of that—keeping the Mariners from hitting the ball far. They’ve done it all season.
The third key will revolve around Dusty Baker’s decision making on when to pull his starter and go to this bullpen. Will Dusty Baker stick with his starter (he’s done it all season) or go quickly to his excellent bullpen (he did throughout the 2021 postseason with a weaker bullpen). It’s something I’ll be watching closely.
If the Astros can navigate through this handful of mine fields, they have an advantage in most other categories. Usually, the advantage is slight, but it is clear and consistent. The odds don’t always work out in short series baseball, but they should give Astros fans confidence walking into this series.
The Pitching
We’ll start on the mound, as both teams have high level pitching staffs. The chart below shows you the stats and major league ranks for both teams. Despite the 105 run difference in runs allowed, the two teams are similar. The Astros give up 3.2 runs per game but the Mariners give up 3.85, good for 7th in the majors. Both teams give up low batting averages and are pretty close in On Base Percentage, with both having Opponent OBPs below .300.
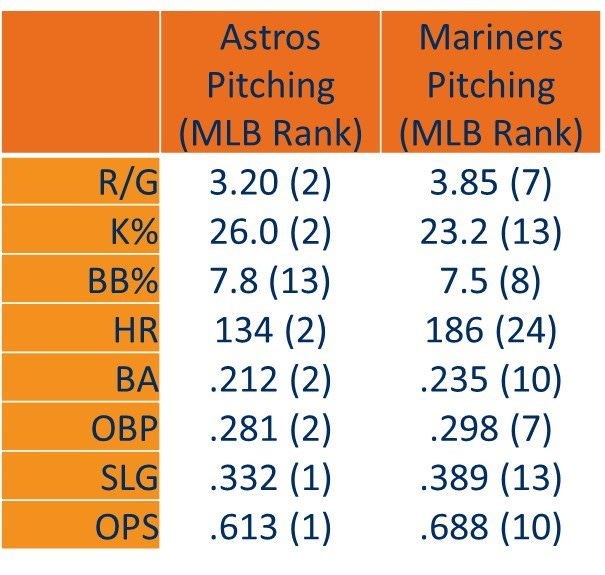
Yet the shape of how they get there is very different. The one category where Mariner hurlers rank ahead of Astros hurlers is in walk rate. The Mariners are 8th best in this category while the Astros are 13th.
Yet Mariner pitchers give up homers—lots of them. They gave up 186 homers this season, 24th best in the majors. Astros pitchers gave up only 134 home runs—52 less than the Mariners this season. It produced a major league leading opponent slugging percentage of .332.
The Rotations
You can get a sense of both the quality of these two pitching staffs and the Astros advantage by looking at the rotations for each team, sorted by ERA+. The Mariners have three above average starters, and their fourth best starter by this measure won the Cy Young Award last season.
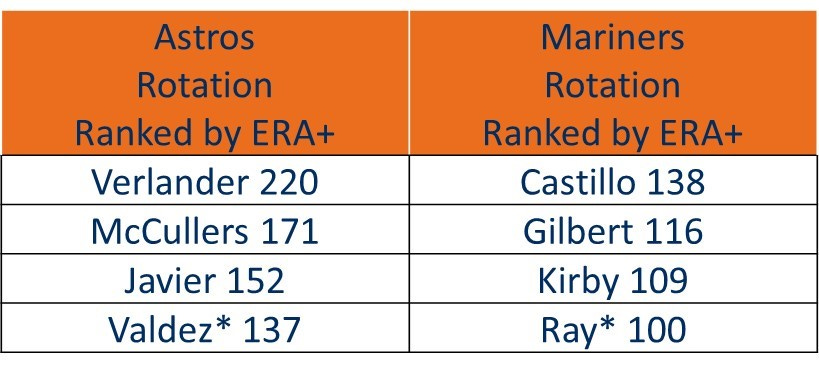
But the Astros rotation is better across the board. And the biggest reason for that edge is Justin Verlander. Verlander led the American League in ERA, WHIP, and hits per nine innings. And he’s backed up by three excellent starters. The underlying numbers for McCullers are not as strong as his ERA (his FIP is 3.49), but he has pitched well since returning from the IL.
The rotation is the biggest advantage for the Astros.
The Bullpens
The bullpen is closer. The Mariners bullpen arms have an excellent reputation, and are given credit for the team’s excellent record in one run games over the last two seasons.2 But running the numbers in the table belows shows them to be less impressive than their reputation. For me, that is primarily the numbers of Paul Sewald, who is last in FIP on this list of the five Mariner relievers most likely to be used in the series.
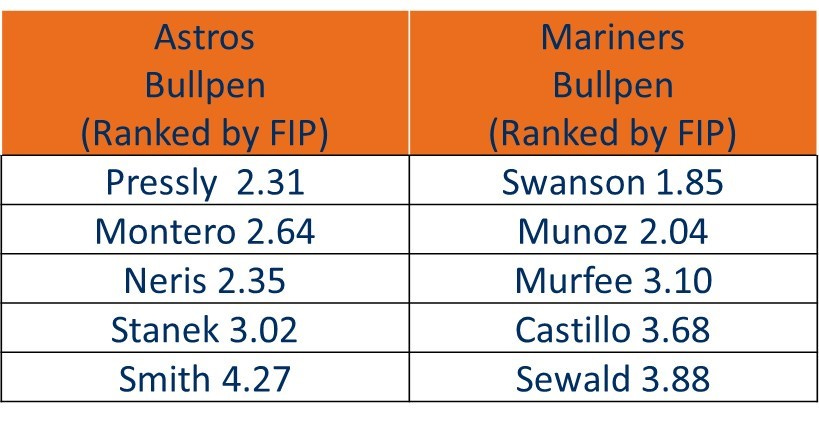
Andres Munoz has developed into their best relief arm, and Mariners manager Scott Servais used him that way in closing out the Game 1 win over Toronto. Eric Swanson has the best FIP (and ERA) of any Mariner reliever, but Servais did not use him at all in the Game 2 comeback.
For the Astros, Dusty Baker and pitching coaches Josh Miller and Bill Murphy have tended to use the bullpen in a very linear fashion. When rested, particular relievers pitch in particular innings to close out a game. Neris is usually the 7th inning guy; Montero has the 8th, and Pressly the 9th. The numbers show this has worked out well this season.
One potential key this series is Will Smith. The Mariners have 3 left handed hitters and 2 switch hitters in their projected lineup, and Smith may be called upon to get those hitters over a righty like Bryan Abreu.
On the other hand, the Mariners top left handed reliever is Matt Boyd, who pitched only 13.1 innings this season and walked 8 batters in that time. He is likely to pitch some against the Yordan-Bregman-Tucker pocket of the Astros lineup. Boyd will get the platoon advantage against two of these three hitters, but they are all patient and his control issues may be an advantage for the Astros.
Overall, the two bullpens are pretty close.
The Fielding
Both of these teams are really good at catching a baseball. The easiest way to explain this is my looking at the Defensive Efficiency metric, which is a simple measure that looks at the percentage of balls hit into the field of play that are turned into an out. The Mariners do this 71% of the team, 4th best in the majors. The Astros do this 72% of the time, 3rd best in the majors.
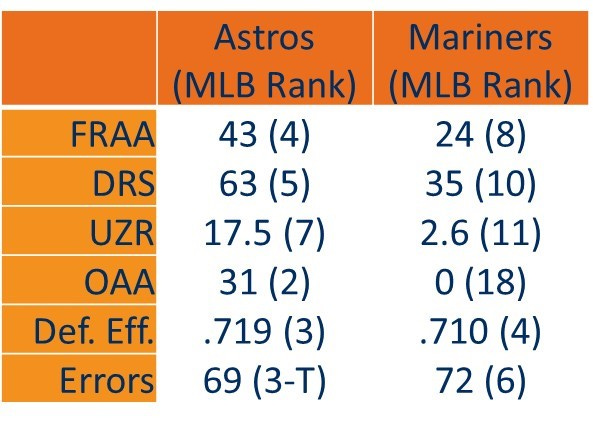
The other defensive metric use more detailed data and they show a bigger, though not huge, advantage for the Astros defense. And while it is a less important factor than the advanced metrics, it is worth noting that both teams make very few errors. The Mariners have their one small edge in defensive numbers here.
The Hitting
I did a deep dive recently on the Astros bats recently, and concluded that while “they have taken a step back from their league leading numbers in the 2021 season, but the step back is modest. The team remains in the top third of the majors in most offensive categories.”
You can see those results in the table below. The Astros are not one of the single best hitting teams in the majors, but they stack up very well. As for the Mariners, welp.
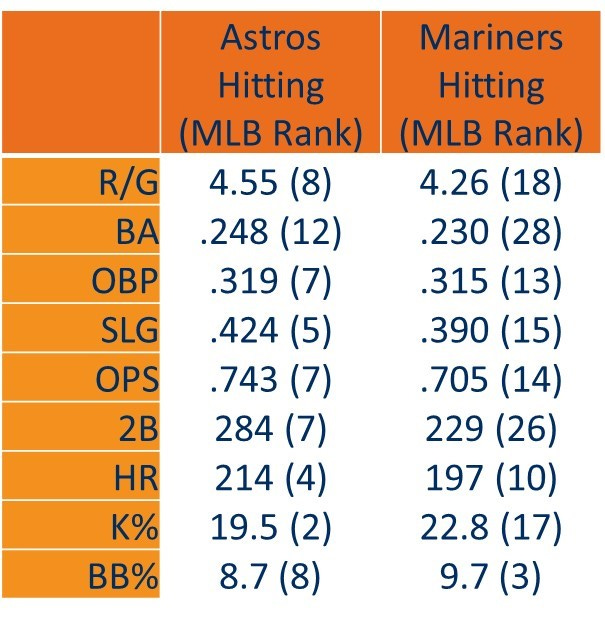
The Mariners are in the middle third in a most all of the offensive categories listed here. Most importantly, they are 18th in the majors in runs scored per game. They do not do have an impressive offense. They are a low batting average and high strikeout team, and that might be a particular problem facing an Astros pitching staff that is second best in the majors in strikeout rate and batting average allowed.
The Lineups
The table below shows you the projected lineups for both teams with the nine players3 ranked by OPS+.4 That seems to be the best way to show the strength of each lineup in comparison to each other.
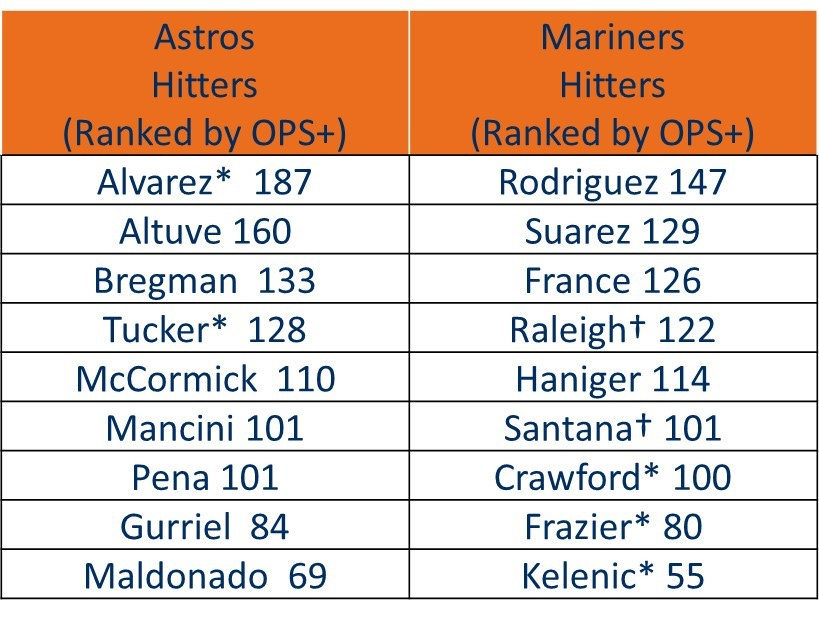
I think it is more helpful to read this particular chart from bottom to top. If you do that, you can see the similarity between the two teams’ lineups. The second worst hitter in each lineup has an OPS+ in the 80s, the third and fourth worst hitters are right around league average, the fifth from the bottom for each team is in the 110s.
But then we start to see some separation between the two teams. The fourth best hitter on the Astros (Kyle Tucker) is six points ahead of the fourth best hitter on the Mariners (Cal Raleigh); the third best hitter on the Astros (Alex Bregman) is seven points better than the third best hitter on the Mariners (Ty France).
Then there are huge gaps at the top. Jose Altuve is the Astros 2nd best hitter, and his 160 OPS+ dwarfs the 129 of Eugenio Suarez. And Yordan Alvarez 187 OPS+ is 40 points better than that of Julio Rodriguez’s 147.
In short, the Mariners have lots of really good players; all playoff teams do. They have five batters well above league average. So do the Astros, but the Astros stars are much better hitters in general than the Mariners stars. It’s their biggest offensive advantage over the Mariners
Keys to the Series
Mariner hitters were 3rd best in the majors at drawing walks at 9.7%, while Astro pitchers were only 13th best at allowing walks at 7.8%. It is the biggest strength of the Mariners hitters versus the biggest weakness of Astro pitchers. If the Astros can limit the walks that the Mariners can draw, it will be hard for Seattle to hit enough to win the series.
The Astros biggest advantage is in home runs. They hit 214 this season—that’s fourth best in the majors. The Mariners gave up 186—that’s 6th worst. Astros pitchers only gave up 134 homers—2nd best in the majors. The Mariners slugged 197 homers—10th best. Home runs are very important in playoff baseball because it is harder to string together rallies as teams try to limit themselves to using their best pitchers. If the Astros advantage in home run hitting and prevention during the season manifests itself in the series, they should win.
When will Dusty Baker turn to his bullpen? In the 2021 playoffs, Dusty had a quick hook, in large part because his starting rotation was more suspect, especially after Lance McCullers went out with an injury. His rotation is deeper and better in 2022, thanks to improvements from Framber Valdez and Cristian Javier and the return of Justin Verlander. As a result, Astros got the most innings from starters in 2022 of any team in baseball. Will Dusty stick with his starters as his did in 2022, or rely on his bullpen early, as his did in 2021?
Will The Astros Advantages Hold Up?
Overall, the Astros have a clear advantage in this series. If you look at most of the statistics shown here, you can see that the Mariners have good numbers, the Astros have better ones. The Mariners have good starting pitchers; the Astros have better ones. The Mariners have a number of stars in their lineup; the Astros have better ones.
I have identified one key advantage for the Mariners (they walk a lot and Astros pitching tends to give up a lot), but outside of that, the advantages exist for the Astros. There is, after all, a reason that the Astros won 106 games this season.
This is why Fangraphs has the Astros projected as a favorite to win the series. And they win it 58% of the time. FiveThirtyEight.com has the Astros as an even stronger favorite at 67% to win the series.


These are solid odds for our favorite ballclub. They reflect what we have seen all season—this is a good baseball team with lots of good players. Winning 106 games is not a fluke.
But the playoffs are of course a crapshoot. A short series is not a reflection of a team’s true talent levels, but an exciting competition that drives eyeballs to television screens as teams play off for a championship.
The Astros have an advantage over the Mariners, and would be likely to win a best of 73 or something like that. But this is only a best of five. Weird things happen in baseball. Let’s just hope they don’t in this series.
Instead, let’s hope for things we think we can rely on—Justin Verlander dealing, Alvarez and Altuve hitting bullets, Bregman taking walks, the pitching staff keeping the ball in the park, and Montero and Pressly shutting things down on the back end.
May the advantages the Astros have show up over the next week. If so, the series will follow the odds.
Prepare for more late night action. While game times have not been announced, it is likely that Game 3 or Game 4 in Seattle will be held during late night hours in the central time zone; and even more late night here on the East Coast.
The Mariners were 34-22 in one run games this season; 33-19 in 2021.
Based on playing time over the last month, I have Trey Mancini in the lineup and Aledmys Diaz out. And the Mariners are likely to start Dylan Moore in left field over Jared Kelenic. Jesse Winker and his 101 OPS+ should be in that spot, but he injured his neck in the season’s final days.
As a reminder, OPS+ is scaled so that 100 is league average. Numbers below 100 show what percentage worse than league average that player’s OPS is and numbers above 100 show what percentage better than league average a player is at the plate.