


Justin Verlander's Strikeout Rate is Down
After years of above average strikeout rates, Justin Verlander is below league average this season. It's mostly driven by a decrease in velocity.

Yesterday, Justin Verlander struggled through 4.2 innings in Cincinnati. Some may blame the 8 hits he allowed, which tied a season high. Some may blame the 4 walks, which also tied a season high.
To me, I focus on the fact he only had 3 strikeouts. Verlander faced 26 batters, and only three went back to the dugout without making contact. That’s a strikeout rate of 11.5%.
The 3 strikeouts and 11.5% strikeout rate are not season lows for Verlander. He struck out only 2 batters in each of two back-to-back starts on May 1 and May 7. But the fact that 3 strikeouts is a season low tells you something important about Justin Verlander’s 2024 season. He’s not striking out as many batters as he used to. Heck, he’s striking out fewer batters than the average major league pitcher.
Declining Strikeout Numbers
The graph below shows Verlander’s strikeout rate and the major league average for every season of his career. Like all of the games greats, Verlander strikes out a lot more batters than the average major league pitcher. After a cup of coffee as a 22 year old, Verlander quickly started striking out more and more batters. He had a brief lull in his age 32 season, brought on in part by an injury.
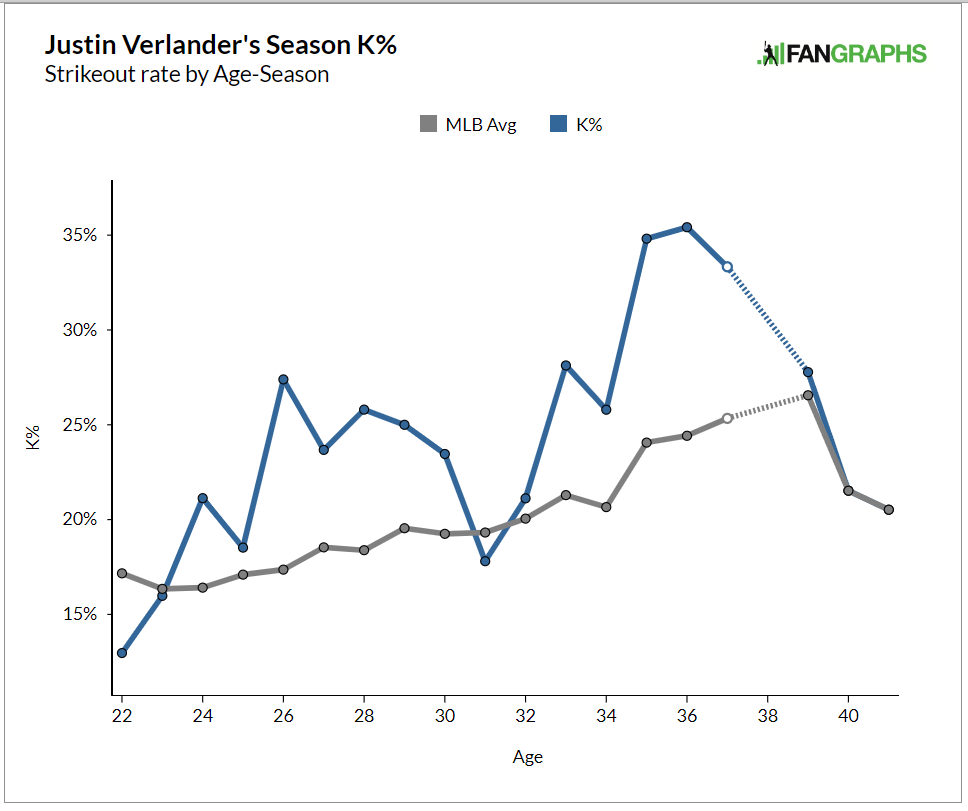
Shortly after that Verlander joined the Astros. See if you can spot when he did that and was influenced by the philosophies of Brent Strom and the advanced data metrics of the Astros analytics department. Hint, it’s where the big spike happens.
You will not that the bottom of the graph is listed not by year, but by age. Ballplayers usually peak around the age of 27, but the greats can defy the aging curve for a long time. You can certainly see that with Verlander, who boosted his strikeout rate to over 34% in 2018 and 2019 when he was 35 and 36 years old.
Verlander missed the 2020 and 2021 seasons due to Tommy John surgery. When he returned in 2022, he was again an ace, but one with a more modest strikeout rate. His strikeout rate has declined in the two season since then.
Strikeouts are produced by inducing whiffs, and the graph below shows the game story for Verlander’s swinging strike rate. . He’s been good at getting them throughout his career; it peaked in the late 2010s when he joined the Astros, and it’s been near league average ever since.

In both graphs, we see the same pattern—good numbers, a jump in the late 2010s, and then a decline in the 2020.
Declining Velocity
What explains this pattern of gains in the late 2010s and declines in the 2020s? One explanation is velocity. The graph below shows Verlander’s average velocity on three of his pitches—his fastball, slider, and changeup.

Verlander, like many pitchers, was able to increase his velocity in the late 2010s, as teams figured out how to train pitchers to throw harder. But over the last two season, Verlander has lost zip on these three pitches. He is throwing each of them less hard than he was able to in his Cy Young seasons of 2019 and 2022.
More velocity from the pitcher makes it more difficult for the hitter. He has less time to recognize a pitch and must decide quicker whether and how to swing. More velocity leads to more strikeouts and fewer hits.
Why has Verlander lost velocity? It is not likely to be because he has stopped doing the workouts that helped him gain velocity back in the late 2010s. Instead, it’s because his body can’t throw it as hard anymore. Father Time remains undefeated.

A Silver Lining
While Verlander has struggled to strike out batters this season, he has still, on occasion shown the ability to do it. Verlander has had five starts this season where he has struck out over 30% of the batters that he has faced, including his August 21 start when he first returned from the injured list. He has twice struck out 9 batters in a game—in a two start stretch on May 24 and 29.
These results suggest that Verlander can still strike batters out on occasion, if he’s right. He suffered his lowest strikeout games of the season in his 3rd and 4th start of the year, but then had a stretch of four starts where he struck out 29.6% of the batters. His strikeout rate declined in two June starts before he went on the injured list.
I’ve expressed great concern over Verlander’s strikeout rate over the course of this article, and have focused on age as the reason for the decline.
But these numbers give some hope for Verlander. One way to interpret them is that Verlander was working out the kinks from his offseason injury in his first four starts of the season, but then got things worked out and Verlander was able to strike out an above average share of hitters. He then got hurt and that explains the decline in June.
If that is the case, then it is possible that Verlander has had to once again work out some kinks in either his body, his arm, or his mechanics that developed as a result of his stint on the injured list. If so, he may soon be at a physical peak—he has three starts since coming off the IL; it took him 4 starts to get there in the Spring. And that peek might produce more strikeouts.
That’s obviously an optimistic gloss. The broad picture of the data are clear. Justin Verlander is striking out fewer batters than the average major league pitcher in large part because his velocity is down. For Verlander to be more effective in the last month of the season, he needs to strike more batters out.
Great analysis and read