
fWAR Projections and the Playing Time Problem

fWAR is a zero sum game, yet almost every player in the league is projected to be better. That shouldn’t be possible
The issue isn’t the WAR framework itself. It’s the playing time assumptions baked into depth charts.
We give far too much certainty to the innings and plate appearances of top players. Stars are almost always projected to max out PA or IP, not because that’s the most likely outcome, but because people react badly when they don’t.
FanGraphs has experimented with this. When top players are projected for more realistic playing time, fewer plate appearances, fewer innings, more missed time etc.
They don’t read it as realism, so the system bends toward health and availability.
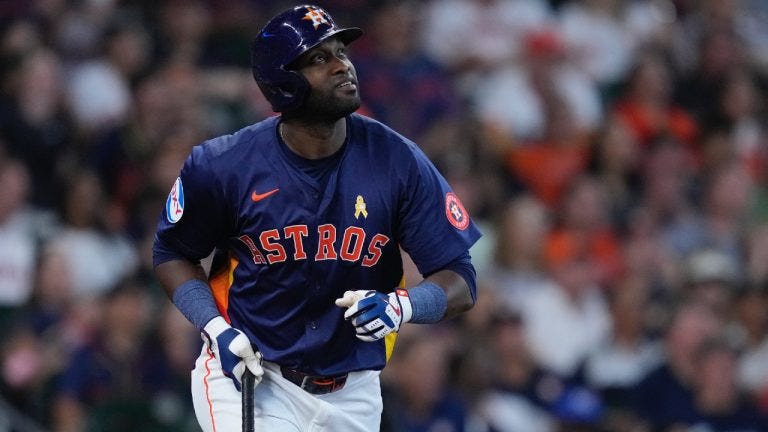
This is why February projections can make 85-win teams look like 90-win teams without changing a single run estimate. The extra wins come from assumed availability, not better performance. A player like Yordan Álvarez can be projected for close to a full season even when the more likely outcome is something closer to 130–140 games.
That bend creates the illusion that the league improves all at once.
You can see the correction when you move away from depth charts and into simulations. Once uncertainty is allowed back in, league WAR compresses quickly. In simulations, totals usually land somewhere between 975 and 1,025 WAR. The zero-sum nature reasserts itself.
Depth charts aren’t predictions. They’re stabilized inputs. They flatten variance so the output doesn’t look wrong to human readers.